Four Visual Formats From One Upload
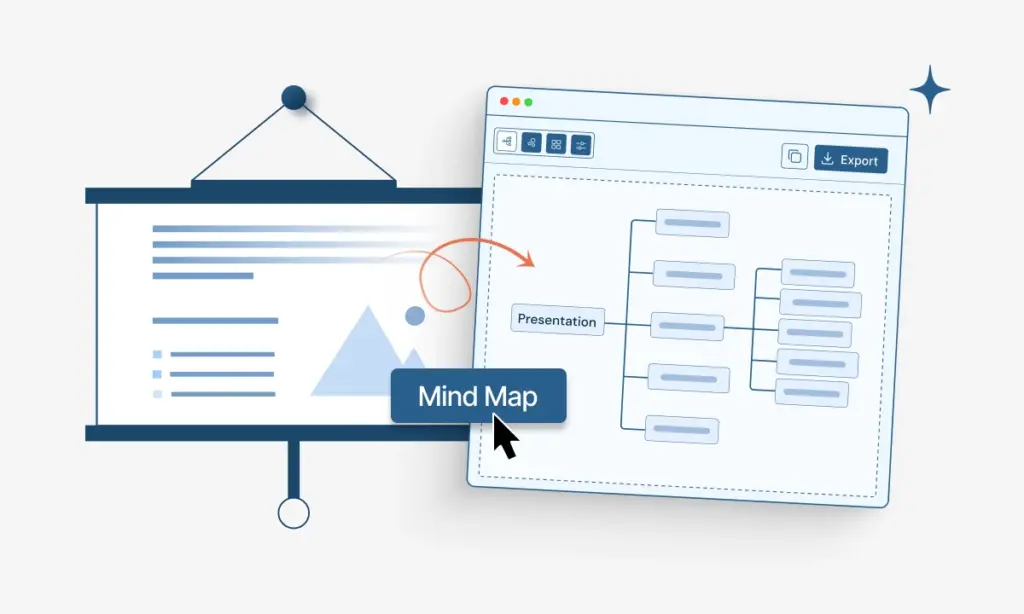
Why settle for one output? The AI infographic generator returns four visual formats from the same source: an infographic for sharing, a mindmap for context, a flowchart for steps, and a quiz for engagement.
Designing infographics by hand eats afternoons. The TubeOnAI AI infographic generator turns any YouTube video, PDF, article, or dataset into an on-brand visual in 90 seconds. Same source also exports as a mindmap, flowchart, or quiz.
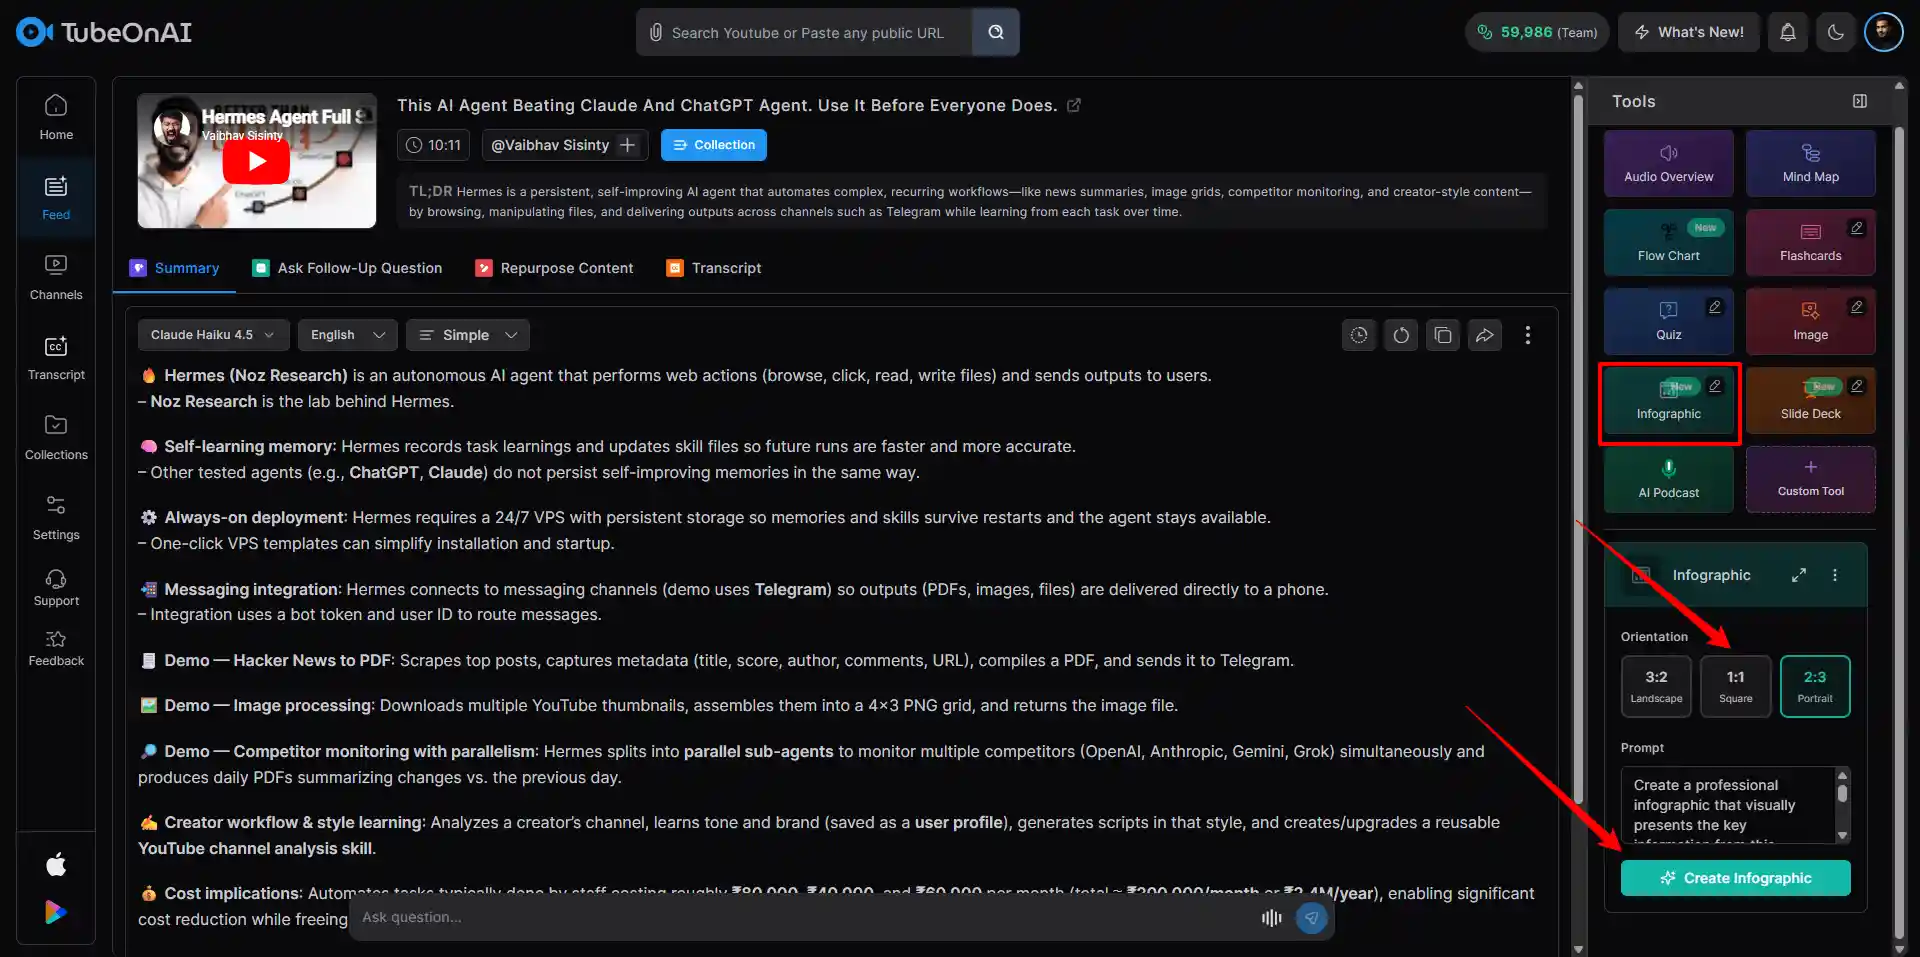
Drop in a YouTube link, a PDF or .docx, or an article URL. The AI infographic generator reads the source end to end before deciding what makes the cut for the visual.
Try for free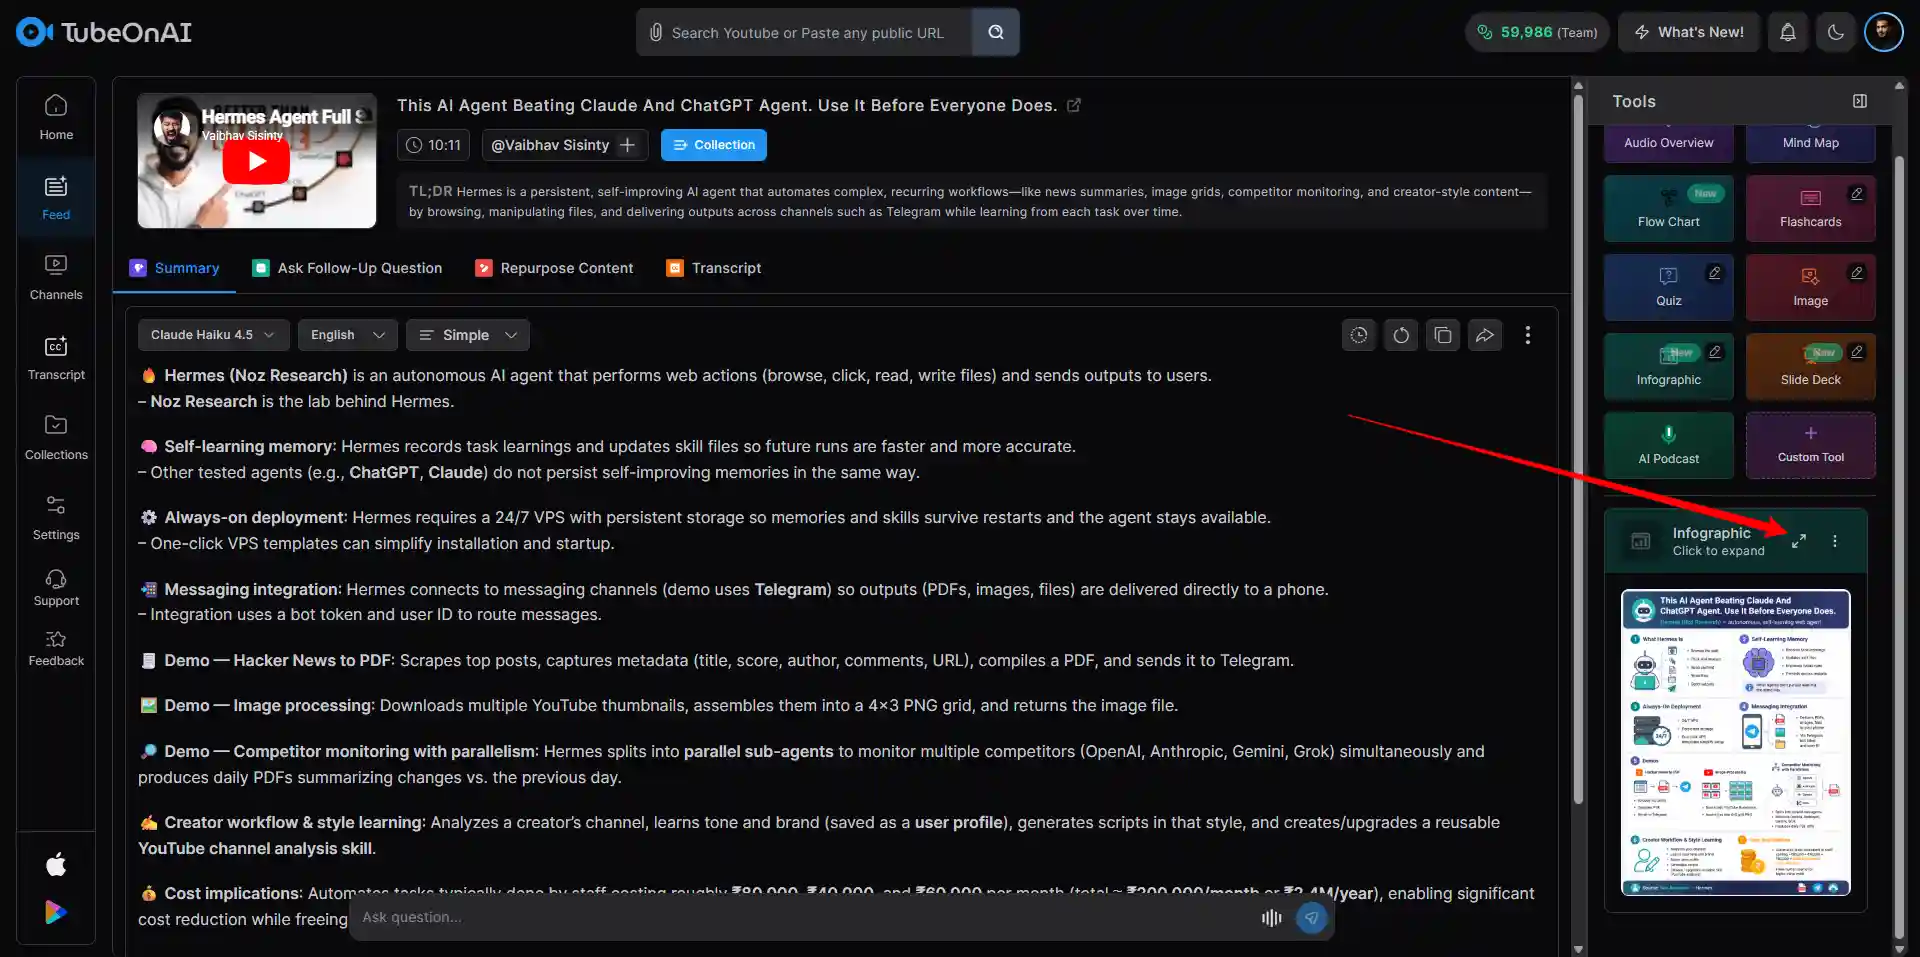
The infographic maker surfaces the headline numbers, anchor sections, and visual hierarchy, then renders an editable layout. Don't like the angle? Regenerate and the structure rebuilds.
Try for freeSave the infographic as PNG, SVG, PDF. Embed straight into Notion, your LMS, or a blog post. Or pivot the same source into a mindmap, flowchart, or quiz with no re-upload.
Try for freeWhy settle for one output? The AI infographic generator returns four visual formats from the same source: an infographic for sharing, a mindmap for context, a flowchart for steps, and a quiz for engagement.
Why settle for one output? The AI infographic generator returns four visual formats from the same source: an infographic for sharing, a mindmap for context, a flowchart for steps, and a quiz for engagement.
Grab the embed snippet. Drop it into Notion, Canvas, Moodle, WordPress, or your wiki. The infographic stays interactive on the page: readers hover for source details, click sections to expand, and share without leaving. Mindmaps, flowcharts, and quizzes from the same source embed identically.
Pick your delivery. PNG for social posts and blog headers. SVG for print and retina. PDF for reports and handouts. JSON for piping infographic data into a design tool, automation, or version control. The AI infographic generator covers all four.
Free to try. No credit card. Every run from the AI infographic generator includes mindmaps, flowcharts, quizzes, and embed snippets, not paywalled extras.
Quarterly campaign data, customer survey results, a research report nobody reads. Feed any of it to the AI infographic generator and ship a shareable visual in time for the launch. Plug into a tweet, a deck, or a landing page hero.
Lecture slides land flat as a PDF. The AI infographic maker turns the same content into a one-pager students actually scroll through, then spins a mindmap and quiz from it for assigned review. Embeds straight into Canvas, Moodle, or Notion.
Repurpose, don't rewrite. Run a YouTube video, research article, or interview transcript through the AI infographic generator and get a Pinterest-ready visual, an SOP flowchart, or a JSON deck for your own automation.
My patients ignored the photocopied handouts. Now I run my session notes through this AI infographic tool and they take the page home. The cliff-notes-in-a-page format made the homework stick in a way bullet lists never did.
I used to spend Sunday afternoons in Canva. Now I drop my YouTube script into this AI infographic generator and a Pinterest-ready visual is rendered before my coffee cools. Channel referrals from Pinterest roughly doubled this quarter.
Group project, four people, one Canva file, three opinions on the color palette. We ran our research through this free infographic generator and the visual was rendered in two minutes. Saved a Sunday and the prof thought we hired a designer.
Conference posters used to take a week. With this AI infographic maker I drop my paper, pick the editorial style, and walk into the session with a poster that gets read. Booth conversations doubled at the last conference.
40-page quarterly reports went straight to the inbox graveyard. I started running each section through this AI infographic generator and shipping a one-page recap up top. Open rates jumped from 12 to 58 percent in one quarter.
Chart screenshots do not sell on X. Annotated infographics do. I take each weekly setup, run it through this infographic maker, and post the visual instead of the raw chart. Engagement is roughly 3x and follower growth tracks the post quality.
Three steps. Paste a YouTube link, upload a PDF or .docx, or drop an article URL. The AI infographic generator reads the full source, extracts headline data and the section breakdown, and renders an editable infographic in under 90 seconds. Tweak colors, icons, and layout in place, then export.
Four. PNG for social and blog headers, SVG for print and design work, PDF for reports and handouts, JSON for programmatic pipelines. The AI infographic generator ships all four in every export.
Yes, that is the entire point of the same-source approach. Once the file is uploaded, the AI infographic generator pivots the content into a mindmap, flowchart, or quiz with no re-upload. Switch formats inside the workspace.
Because most infographics are stops along the way, not finish lines. JSON lets you re-import the structure into Figma, version-control the visual alongside your docs, or pipe the data into automation. The AI infographic generator ships JSON by default for that reason.
Data-rich, structured material wins. Quarterly reports, research papers, comparison articles, blog posts with embedded statistics, and lecture videos with on-screen slides give the AI infographic generator the cleanest hooks. Loose narrative content still works but tends to produce more generic visuals.
Yes, often. Hit Regenerate, optionally pick a fresh style preset (corporate, editorial, vibrant) or layout density, and the AI infographic generator rebuilds from the same source. No re-upload, and versions sit side by side for comparison.